
A Primer on Dimensions & Measures in Tableau - Part 1
When we connect to a data source, Tableau performs the below two actions:
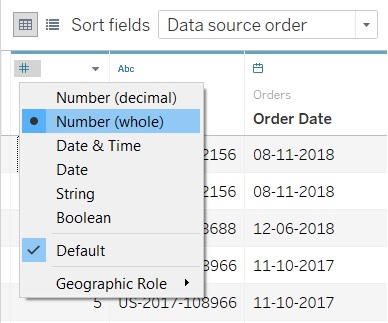
Action#1: Assigns a data type such as Number, Date, Date & Time, String, Boolean, Geographic.
This can be checked by clicking on the icon at the top left corner of each field in the Data grid of the Data Source Page.
In case the Tableau assigned data type is incorrect we can update it to the correct data type provided the entries are compatible.
NOTE: The view of Data grid is subject to changed based on Tableau version used.
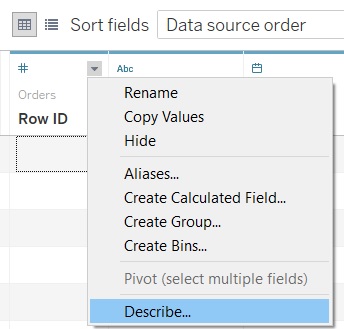
Action#2: Assigns a role i.e. it splits the fields into Dimensions and Measures.
This can be checked by clicking the drop-down icon at the top right corner of each field in the Data grid of the Data Source Page.
Next click on Describe
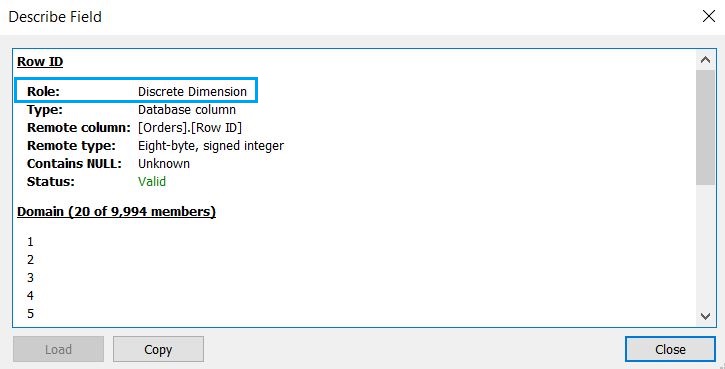
The dimension type will be displayed in Role
Given below is an example of a Discrete Dimension field
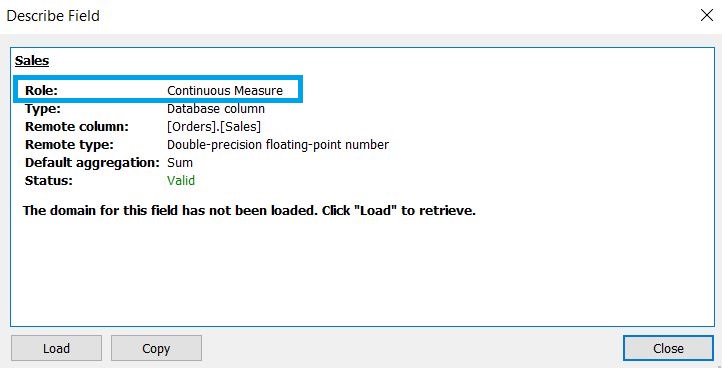
Given below is an example of a Continuous Measure field
The dimension and measure check can also be done in the worksheet in the "Data" pane. The line separates the Dimensions and Measures. The fields that are above the line are Dimensions and the fields below the grey line are Measures.
NOTE: The details about the Blue color for Dimensions and Green color for Measures will be covered in Part 2 of this article.
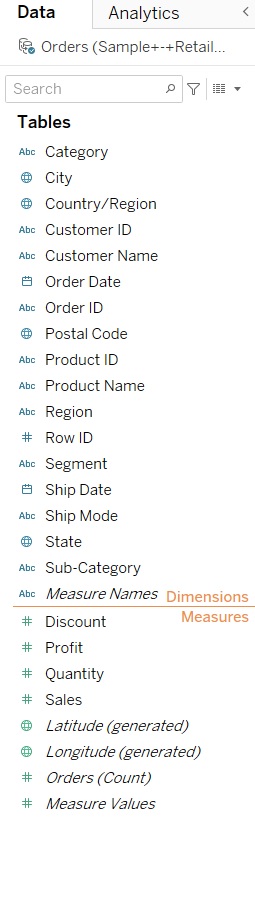
Dimensions are the Qualitative fields (such as Ship Mode, Segment, Customer Name). Dimensions are generally used to Slice and Dice the data i.e. to categorize or segment the data. Dimensions provide the level of granularity or the level of detail in the view.
These are sometimes also referred to as independent variables.
Measures are the Quantitative fields that can be measured (such as Sales, Profit, Quantity). Measures can always be aggregated. These are sometimes also called dependent variables.
AGGREGATION AND LEVEL OF GRANULARITY
Measures are by default aggregated and the Dimensions provide the granularity or detail in a visualization.
When we drag a measure for e.g.: Sales into the view, Tableau by default applies an aggregation to that measure. The default aggregation of any measure will be SUM.
This view will have only 1 Mark that can be confirmed by checking the bottom left of worksheet view.
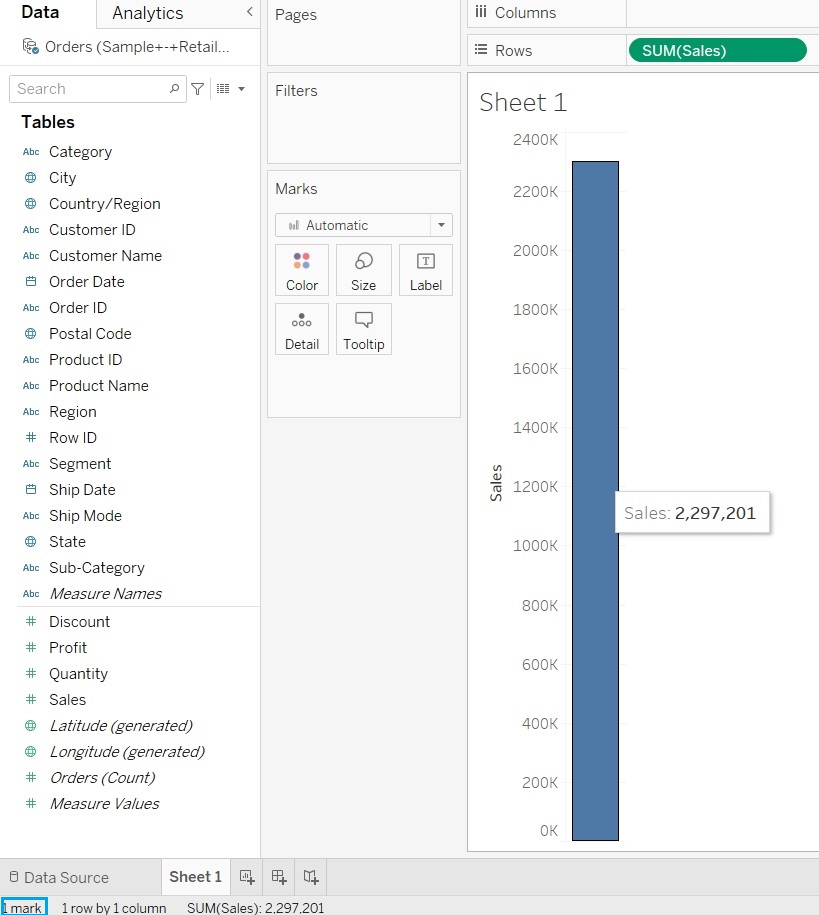
So this is the MOST aggregated view w.r.t the Sales measure.
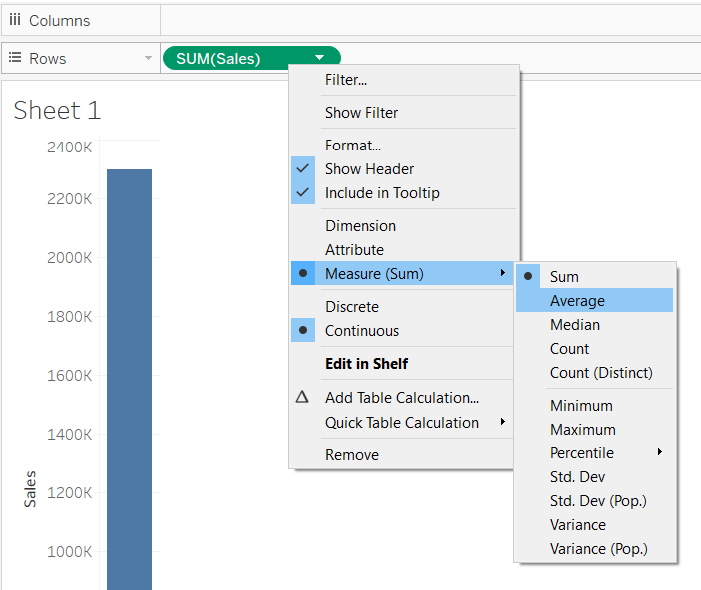
We can change the aggregation by right-clicking on the measure. We can select the required aggregation e.g.: Average
Next we drop a dimension like Category into Columns Shelf. The dimension will divide the measure into different segments. We will be having the number of Marks based on how many entities are present in the dimension.
In this case there would be 3 marks as there are 3 entities in Segment viz. Furniture, Office Supplies and Technology.
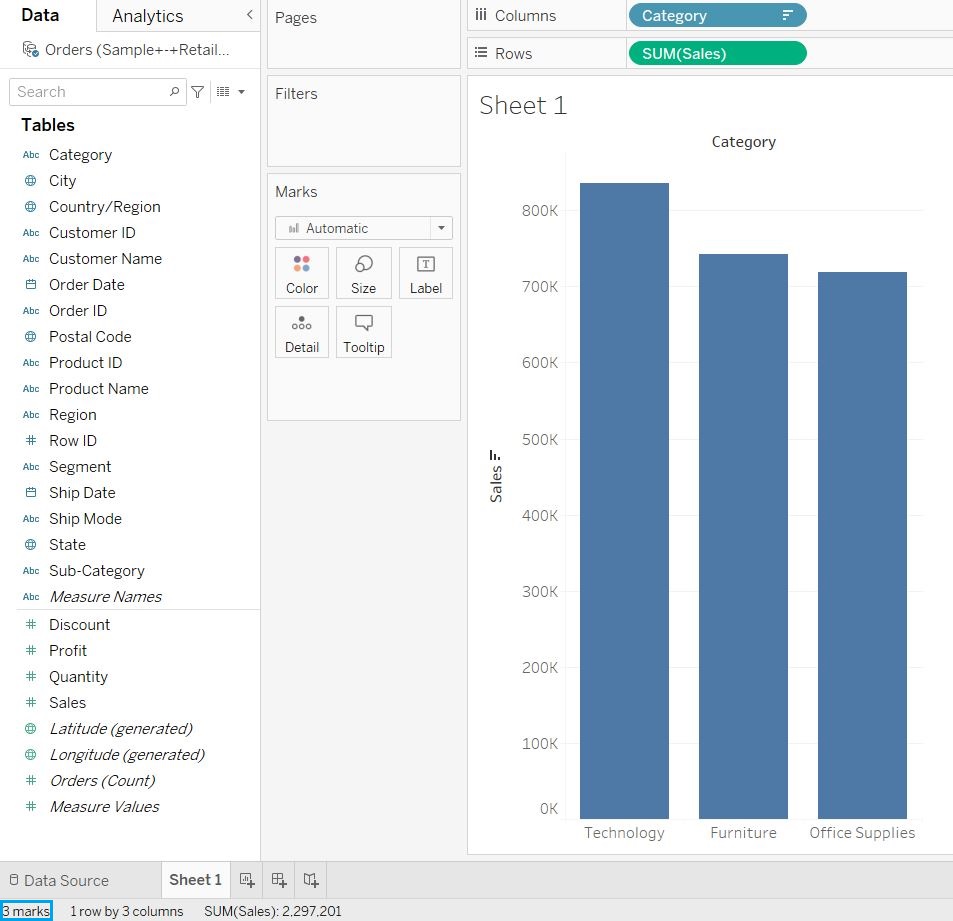
So this is a MORE disaggregated view.
Next we drop the Sub-Category into Columns Shelf we will be getting more marks based on the entities present in the new dimension. In this case there would be 17 marks as there are 17 entities in the Sub-Category.

So this is the MOST disaggregated view when it comes to Category and Sub-Category.
In the Part 2 of this article I will be covering the further topics w.r.t Dimensions and Measures and how they are related to Discrete and Continuous fields.
DISCLAIMER:
This article is not meant to be a Tableau tutorial and the steps mentioned are to be considered only for reference purpose. The intent of this article was to provide the basic introduction to Dimensions and Measures in Tableau.
REFERENCES:
https://help.tableau.com/current/pro/desktop/en-us/datafields_typesandroles.htm
- Deepak Holla
- Jun, 28 2022