
Advanced DAX - Relationship Functions
Advanced DAX - Scalar Functions
So today we are going to learn what are Relationship function in advanced Data Analysis Expression.
DAX
Data Analysis Expressions (DAX) is a formula expression language used in Analysis Services, Power BI, and Power Pivot in Excel. DAX formulas include functions, operators, and values to perform advanced calculations and queries on data in related tables and columns in tabular data models.
This article provides the most important concepts in DAX.
Relationship Functions
▸The RELATED function requires that a relationship exists between the current table and the table with related information. You specify the column that contains the data that you want, and the function follows an existing many-to-one relationship to fetch the value from the specified column in the related table.
▸Functions :
1. CROSSFILTER
2. RELATED
3. RELATEDTABLE
4. USERELATIONSHIP
1. CROSSFILTER
- Specifies the cross-filtering direction to be used in a calculation for a relationship that exists between two columns.
- Syntax : CROSSFILTER(<columnName1>, <columnName2>, <direction>)
- The function returns no value; the function only sets the cross-filtering direction for the indicated relationship, for the duration of the query.
Example
In the following model diagram, both DimProduct and DimDate have a single direction relationship with FactOnlineSales.

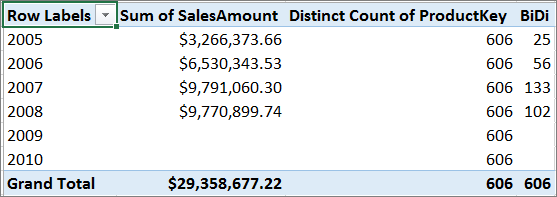
By default, we cannot get the Count of Products sold by year:
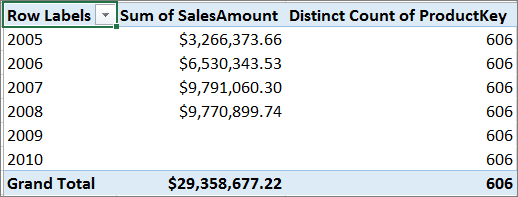
There are two ways to get the count of products by year:
Turn on bi-directional cross-filtering on the relationship. This will change how filters work for all data between these two tables.
Use the CROSSFILTER function to change how the relationships work for just this measure.
When using DAX, we can use the CROSSFILTER function to change how the cross-filter direction behaves between two columns defined by a relationship. In this case, the DAX expression looks like this:
▹Example : BiDi:= CALCULATE([Distinct Count of ProductKey],CROSSFILTER(FactInternetSales[ProductKey], DimProduct[ProductKey] , Both))
By using the CROSSFILTER function in our measure expression, we get the expected results:
2. RELATED
▹Returns a related value from another table.
▹Syntax : RELATED(<column>)
▹The RELATED function requires that a relationship exists between the current table and the table with related information.
▹You specify the column that contains the data that you want, and the function follows an existing many-to-one relationship to fetch the value from the specified column in the related table.
▹ If a relationship does not exist, you must create a relationship.
▸Example :
In the following example, the measure Non USA Internet Sales is created to produce a sales report that excludes sales in the United States. In order to create the measure, the InternetSales_USD table must be filtered to exclude all sales that belong to the United States in the SalesTerritory table. The United States, as a country, appears 5 times in the SalesTerritory table; once for each of the following regions: Northwest, Northeast, Central, Southwest, and Southeast.
The first approach to filter the Internet Sales, in order to create the measure, could be to add a filter expression like the following:
FILTER('InternetSales_USD'
, 'InternetSales_USD'[SalesTerritoryKey]<>1 && 'InternetSales_USD'[SalesTerritoryKey]<>2 && 'InternetSales_USD'[SalesTerritoryKey]<>3 && 'InternetSales_USD'[SalesTerritoryKey]<>4 && 'InternetSales_USD'[SalesTerritoryKey]<>5)
However, this approach is counterintuitive, prone to typing errors, and might not work if any of the existing regions is split in the future.
A better approach would be to use the existing relationship between InternetSales_USD and SalesTerritory and explicitly state that the country must be different from the United States. To do so, create a filter expression like the following:
FILTER( 'InternetSales_USD', RELATED('SalesTerritory'[SalesTerritoryCountry])<>"United States")
This expression uses the RELATED function to lookup the country value in the SalesTerritory table, starting with the value of the key column, SalesTerritoryKey, in the InternetSales_USD table. The result of the lookup is used by the filter function to determine if the InternetSales_USD row is filtered or not.
= SUMX(FILTER( 'InternetSales_USD' , RELATED('SalesTerritory'[SalesTerritoryCountry]) <>"United States" ) ,'InternetSales_USD'[SalesAmount_USD])
The following table shows only totals for each region, to prove that the filter expression in the measure, Non USA Internet Sales, works as intended.
| Row Labels | Internet Sales | Non USA Internet Sales |
|---|---|---|
| Australia | $4,999,021.84 | $4,999,021.84 |
| Canada | $1,343,109.10 | $1,343,109.10 |
| France | $2,490,944.57 | $2,490,944.57 |
| Germany | $2,775,195.60 | $2,775,195.60 |
| United Kingdom | $5,057,076.55 | $5,057,076.55 |
| United States | $9,389,479.79 | |
| Grand Total | $26,054,827.45 | $16,665,347.67 |
The following shows what that you might get if you used this measure in a report table visual:
| Row Labels | Accessories | Bikes | Clothing | Grand Total |
|---|---|---|---|---|
| 2005 | $1,526,481.95 | $1,526,481.95 | ||
| 2006 | $3,554,744.04 | $3,554,744.04 | ||
| 2007 | $156,480.18 | $5,640,106.05 | $70,142.77 | $5,866,729.00 |
| 2008 | $228,159.45 | $5,386,558.19 | $102,675.04 | $5,717,392.68 |
| Grand Total | $384,639.63 | $16,107,890.23 | $172,817.81 | $16,665,347.67 |
3. RELATEDTABLE
▹Evaluates a table expression in a context modified by the given filters.
▹Syntax : RELATEDTABLE(<tableName>)
▹The RELATEDTETABLE function changes the context in which the data is filtered, and evaluates the expression in the new context that you specify.
▹Example
The following example uses the RELATEDTABLE function to create a calculated column with the Internet Sales in the Product Category table:
Relatedtable = SUMX( RELATEDTABLE('InternetSales_USD') , [SalesAmount_USD])
The following table shows the results:
| Product Category Key | Product Category AlternateKey | Product Category Name | Internet Sales |
|---|---|---|---|
| 1 | 1 | Bikes | $28,318,144.65 |
| 2 | 2 | Components | |
| 3 | 3 | Clothing | $339,772.61 |
| 4 | 4 | Accessories | $700,759.96 |
4. USERELATIONSHIP
▹Specifies the relationship to be used in a specific calculation as the one that exists between columnName1 and columnName2.
▹Syntax : USERELATIONSHIP(<columnName1>,<columnName2>)
▹USERELATIONSHIP can only be used in functions that take a filter as an argument.
▹for example: CALCULATE, CALCULATETABLE, CLOSINGBALANCEMONTH, CLOSINGBALANCEQUARTER, CLOSINGBALANCEYEAR, OPENINGBALANCEMONTH, OPENINGBALANCEQUARTER, OPENINGBALANCEYEAR, TOTALMTD, TOTALQTD and TOTALYTD functions.
▸Example
The following sample shows how to override the default, active, relationship between InternetSales and DateTime tables. The default relationship exists between the OrderDate column, in the InternetSales table, and the Date column, in the DateTime table.
To calculate the sum of internet sales and allow slicing by ShippingDate instead of the traditional OrderDate, create measure, [InternetSales by ShippingDate] using the following expression:
Userrelationship = CALCULATE(SUM(InternetSales[SalesAmount]), USERELATIONSHIP(InternetSales[ShippingDate], DateTime[Date]))
Relationships between InternetSales[ShipmentDate] and DateTime[Date] must exist and should not be the active relationship; also, the relationship between InternetSales[OrderDate] and DateTime[Date] should exist and should be the active relationship.
- VIDHISHA LIMBOLA
- Jun, 20 2022