Image Similarity Search by using Metric Learning
Firstly, lets ponder on the question "How do we map similar objects?".
Generally, we have an object in a n-dimensional space and when we wish to find the similarity between an two objects; we use Euclidian distance or Dot product or several other metrics to find similarity between multiple objects and we can cluster them into classes based on the distance.
But, what is the case when it comes to finding similar images. Because, when given an image, searching similar images from a large corpus of images and gathering them manually is a difficult task.
So here, we are trying to build an end to end machine learning pipeline which can find similar images belonging to the class of an image given to the model.
This feature can be used and is being used in many areas such as product recommendation in ecommerce platform, supermarkets and also as a ranking signal for image search engine.
The dataset used for this experiment is Cifar-10 which consists of around 60,000 images spread equally among 10 different classes; 90% of images are used for training and 10% for testing.
A sample collage of random images of the dataset is given below:

We are going to use Metric Learning for searching similar images.
Metric Learning can be thought of as an optimization problem similar objects are mapped closer while dissimilar objects are getting mapped far away, it means that it trains the model such that objects with similarity are going to be rewarded high score as compared to that of the objects from different classes. It is generally used on datasets with no manually labeled data and this type of learning is called as Self-supervised learning; it is a means of learning used on unlabeled data in which the model auto generates it labels from observing the inputs. Self-supervised learning is deeply intertwined with NLP as it is very useful for building models to predict hidden data, say in a sentence or an audio file or a video file, from the observed data. In this specific example, the model has to categorize itself without providing the target data of the classes.
Metric Learning in this case is done by building a convolutional neural network to extract the information from the image, so that all the information regarding the image is embedded into a vector of 8 dimension. These embeddings are learnt such that the embeddings of two images of same class are similar when compared to images of other class.
The input to the embedding model is sent in the form of a triplet consisting of an Anchor image, a Positive image and a Negative image; where:
Anchor Image - The image that needs to be embedded
Positive Image - A random image that is from the same class of Anchor image and not same as of Anchor image
Negative Image - Any image that is from a different class of Anchor image.
Here is an example collage of the triplet images:

As we can see, the first row of the collage are the anchor images whereas the second row comprises of the positive images of the anchor image of the respective column and the third row is comprised of negative images of the anchor image of the respective column.
The model embeds the anchor image in such a way that the distance between anchor image and positive image is minimized while the distance between anchor image and negative image is maximized.
Here, is the architecture of the embedding model which takes the triplet images as input and output vectors of dimensions 8.

The input is 32*32*3 and the total information of the image is completely embedded into the output of dimension 1*8. The model is comprised of a series of three 2D convolution layers with 'ReLU' activation functions followed by a Global Average Pooling layer and a final layer projecting to an embedded space of 1*8. And also, normalizing the final embedding so that it is convenient for doing dot product for similarity.
The Optimizer used in this model is ADAM. The model is trained for 120 epochs and mini batch processing is used.
Now, coming to the loss function used in the model. Both Triplet loss and Categorical Cross Entropy loss functions are considered for this model.
Triplet loss compares a baseline input to a positive input and a negative input. The distances between the baseline input and the positive input is minimized while the distance between the baseline input and negative input is maximized. In this case, the baseline input is anchor image, the positive and negative inputs are positive and negative images respectively.

Triplet loss is an accurate measure of how well the model works in clustering the classes and below is the mathematical representation of the Triplet loss function.
Categorical Cross Entropy loss, or log loss, measures the performance of the classified model whose output is a probability between 0 and 1. Cross entropy increases as the predicted probability of the label diverges from the actual label.
Categorical Cross Entropy loss is best suited for classification in which the classes are mutually exclusive.

After performing, some preliminary experiments with Triplet Loss and Categorical Cross entropy loss we can observe from their respective confusion matrices that Triplet loss has low inter class variance whereas Categorical Cross Entropy loss has low intra class variance. So, in order to get an optimum model the sum of both Triplet Loss and Categorical Cross Entropy loss is considered as the loss function.

So, this loss function is reduced by producing accurate embeddings by the model for the given image.
After training 120 epochs the loss function has continuously decreased and we were able to get good results.

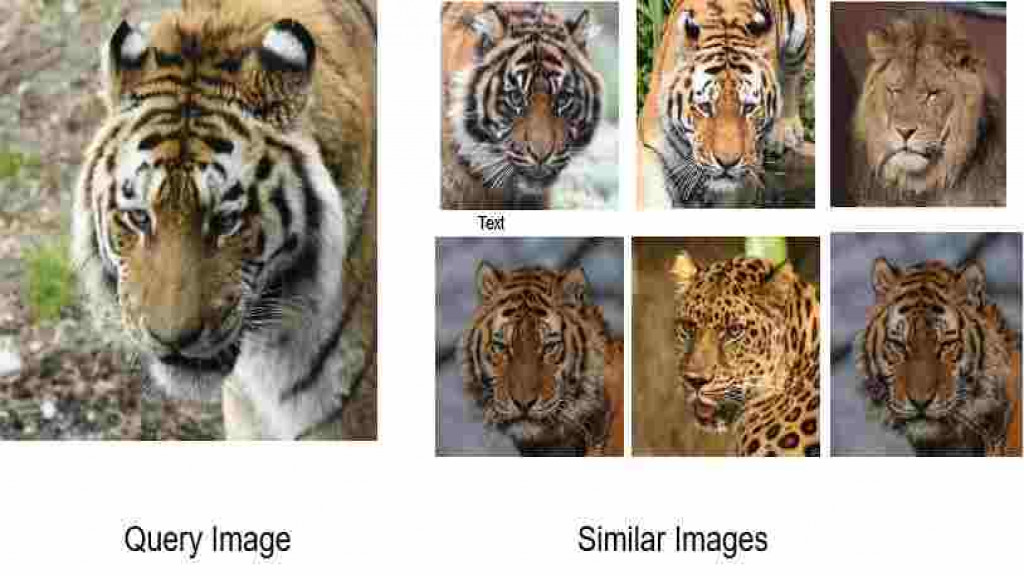
Now, coming to the testing of the model. Below is the collage of the images and its ten nearest neighbors in the class of the image.

As, we can clearly see the first column is input and the respective row for each image is the ten nearest neighbors of the embeddings of the image.
This concept is extremely useful in ranking signal of image search engine and also paves way to visual representation learning.
- Molakaseema Ramakrishna Reddy
- Dec, 27 2022