Introduction to knowledge graphs and their importance
Representing this data is crucial not only to machines but also to developers trying to have a context for their application. So in this article, I want to discuss an interesting representation of data which is Knowledge Graphs.
Terminology
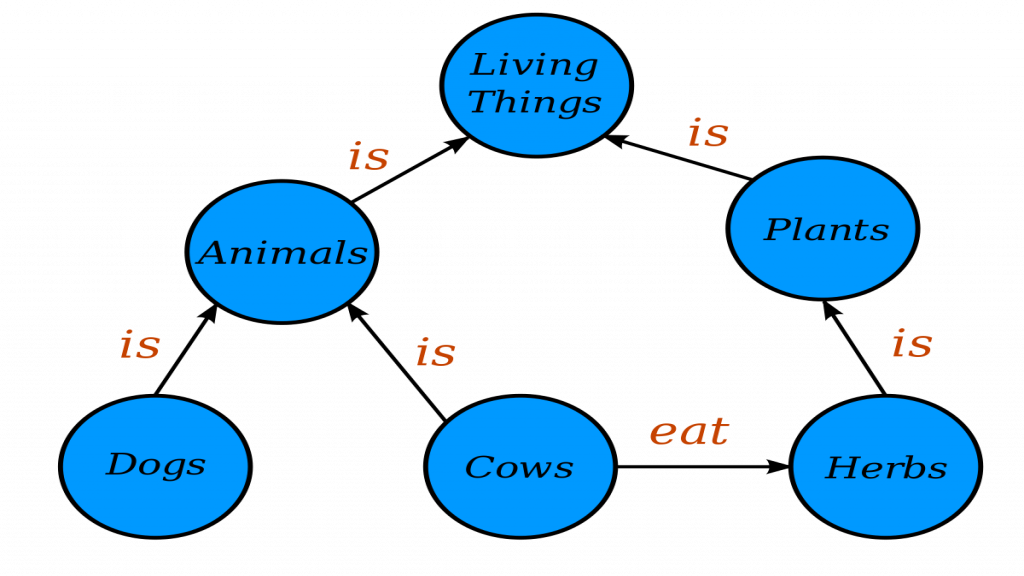
Knowledge graph is essentially a knowledge model that represents a collection of descriptions of concepts, entities, and events represented as nodes, and these nodes are linked together by relationships represented as a directed edge going from one node to another. Each pair of entities that share a relation are called a triplet.

Let’s take an example so we can have a better understanding, In this Knowledge graph our entities include a cow this cow has a relation with herbs entity as a cow eats herbs, you can see that this “eats” relation is the edge between the two entities.
How to create a Knowledge Graph
One thing to notice here is that knowledge graphs are a structured frame to hold any type of data that is not only intuitive but also easy to traverse and extract the required information from.
So to make a knowledge graph you have to make design decisions to get the best out of it so typical design choices are
What to put in the nodes? Which data information do we want to access and get its context?
What are the relations between those nodes? What are the expected properties should these relations between entities represent?
The input to knowledge graph population can come from one or more sources consisting of
structured data, semi-structured data, free text, or images.
When we are working with structured and semi-structured data sources, we have to relate the schema in the input source with the schema of the knowledge graph (its entities and relations) and relate new instances with the pre-existing instances in the knowledge graph.
These exact same tasks are also performed on unstructured sources, but we have to solve the information extraction problems like entity extraction and relation extraction.
Also, knowledge fusion is an important feature in knowledge graphs which is merging bases coming from different sources to get a comprehensive view. Its specific goals are to realize entity alignment which is identifying whether different entities refer to the same objects in the real world. Multiple steps can be taken including generating entity candidates, disambiguating entities by clustering based on contexts in which entities appear, de-duplicating entities by using methods such as word2vec and using machine translation models to bring all entities into the same language.
Applications
Knowledge graphs are leveraged in day-to-day applications so I gathered some applications that would hopefully make it more apparent how useful are these Graphs.
Question answering systems
chatbots are used in many websites to provide a better user experience, we want to aggregate real-time information from multiple sources and learn from the client interactions every time.
Here Knowledge graphs come in handy to take user question input and go to the relevant information quickly, moreover user representation as entities can help in making responses more personalized.
Recommendation systems
Imagine we put customers in a knowledge graph and link them to the items they bought in the past. Now, we try to predict missing links in the knowledge graph and every missing link is a recommendation you can make to someone. Also expanding each customer established connections by a level or two can lead to items relevant to explored items by this customer.
Monitoring rigorous patterns using machine learning algorithms has decreased many risks as it became more automated. So How about representing fraud scenarios in a graphic visual way with a knowledge graph that can aid consultants in identifying patterns and further extend their machine-learning algorithm to include detected patterns and further extend their feature set. So for example, if you have a dataset of customers and when trying to add two customers to the graph and connecting you notice these customers have the same email address so they share the same relation to customers in the system which might raise suspension that they are the same person or one of them has a fraudulent account.
- Menna ElMesalmy
- Mar, 28 2022