KPI’s Improves the visualization
KPI’s Improves the visualization
What is KPI?
A KPI (Key Performance Indicator) is a quantitative measurement for gauging business objectives. It is a high level measure of system output. For example, the sales department of an organization might use a KPI to measure monthly gross profit against projected gross profit. This is an example of a KPI. KPI is used in various sectors to obtain a quick and accurate historical summary of operations or transactions or to identify trends.
A KPI includes :
1)a base value
2)a target value
3)status thresholds.
A Base value means a calculated field that must result in a value. for example, it can be an aggregate of sales or the profit for a specific period.
A Target value is also a calculated field that results in a value—perhaps an absolute value. For example, an HR manager needing to evaluate the number of paid-time-off hours for each employee—and then compare it the average. The average number of PTO days would be an absolute value.
A Status threshold is the range between a low and high threshold. The Status threshold displays with a graphic to help users easily determine the status of the Base value compared to the Target value.
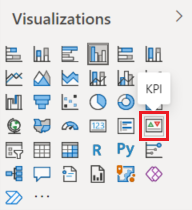
How KPI appears in Power Bi?
KPI appears in power bi visualization tools
as shown in the figure below:
Steps to create Efficient KPI’s:
1.Focus or review Business objectives
2.Analyze current performance or status
3.Set KPI targets and decide the term/period required(short term or lon g term)
4.Discuss and review target with the team
5.Regularly Review and Readjust the progress.
Why KPI’s are Important?
KPIs serve as a guide to help you and your organization to reach your goals. And the pursuit of your goals depends on focused and consistent delivery of results.
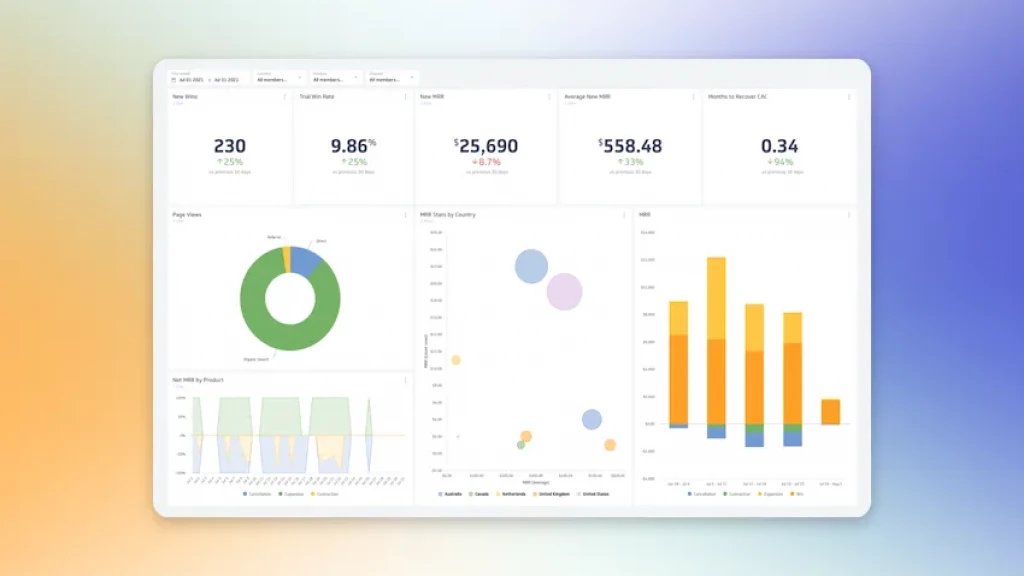
How to report on KPI’s?
A KPI dashboard visualizes how your current performance stacks up against your objectives. In a KPI dashboard you can report your performance at any time.
How to use KPI software?
You can connect to your data sources by simple clicks and bring your most important KPIs onto a dashboard. From there, you can segment, add dimensions, and combine metrics for a customizable and insightful report as required. For this you could use platforms like Power Bi for the convenience.
Finding the best:
There are some best executive KPI’s like Net Profit Margin, CAC etc. Creating an actionable KPI’s like this help us to improve the visualization effects and there by enhances efficiency of visualizations.
- Arathi M V
- Jun, 26 2022