
Most Popular Data Science Interview Questions
Introduction
In this article, I have listed down an excerpt of my Data Science Interview where I was asked questions from various concepts of Data Science.
This article includes Questions based on:
- Probability and Statistics Concepts in Data Science
- Machine Learning
- Deep Learning
Do Give it a try!
Let’s get started,
Interviewer: Tell me something about Data Augmentation? Can you give some examples where this technique might be helpful in our Data Science projects?
Candidate:
👉 It is a technique for synthesizing new data by modifying existing data in such a way that the target column is not changed or if changed, then changed in a known way.
👉 Data augmentation is one of the useful techniques in the Computer Vision domain.
👉 Some of the modifications we can do to create some new images from existing ones-
Resize, Horizontal-Vertical flip, Rotate, Add noise, Deform, Modify colors.
👉 Every problem needs a specifically customized data augmentation pipeline.
For Example,
In Optical Character Recognition(OCR), flipin existing images change the text and won’t be beneficial; however, resizing and small rotations may help to make better models.

Interviewer: RNNs are quite popular among the neural network models. Comment.
Candidate:
👉 Dealing with the sequential data: This is the main reason for using RNNs. RNNs can handle all possible sequential data. For Example, Time series or Text data.
👉 RNN has a memory: The internal state of the RNN is a kind of short-term memory. The information from the previous time step is taken into account in the next timestamp.
👉 Concept-based on the human brain: The process of the human’s short-term memory is very complex. An RNN tries to imitate and simulate this process in a mathematical way. This concept is very powerful and is the basis for further methods like Long Short Term Memory(LSTM).
Interviewer: In k-Means or K-Nearest Neighbor(KNN) algorithm, we use Euclidean distance to calculate the distances between data points or nearest neighbors. Can we use Manhattan distance in place of Euclidean distance for calculating distances between the Data Points? Put your comments on it.
Candidate:
👉 We don’t use Manhattan distance because it calculates distance only vertically or horizontally. Therefore, it has dimension restrictions. On the other hand, the Euclidean distance can be used in any space to calculate the distances between the data points. Since in our problem statements, the data points can be present in any dimension, according to me, Euclidean distance is a more suitable option.

Image Source: Link
Interviewer: Tell me something about the different types of Gradient Descent.
Candidate:
👉 Stochastic Gradient Descent: In Stochastic gradient descent, a batch size of 1 is used. As a result, we get n batches. Therefore, the weights of the neural networks are updated after each training sample.
👉 Mini-batch Gradient Descent: In Mini-batch Gradient Descent, the batch size must be between 1 and the size of the training dataset. As a result, we get k batches. Therefore, the weights of the neural networks are updated after each mini-batch iteration.
👉 Batch Gradient Descent: In Batch Gradient Descent, the batch size is equal to the size of the training dataset. Therefore, the weights of the neural network are updated after each epoch.
Interviewer: Let’s say I have given a dataset, and the dataset has missing values that spread along with one standard deviation from the mean. Now tell me according to you how much percentage of data would remain unaffected and why? (You may assume Normal Distribution here).
Candidate:
👉 Since the data is spread across the mean given it’s a normal distribution, ~68% of the data lies in one standard deviation from mean (median or mode) since for a normal distribution all these three central tendencies are equal, which leaves ~32% of the data unaffected. Therefore, ~32% of the data would remain affected by missing values.

Image Source: Link
Interviewer: How is Standardization different from Normalization Techniques?
Candidate:
👉Standardization: It scales each feature separately such that the feature has the property of a standard normal distribution(mean=0 and standard deviation=1). It is also known as z- score normalization.

👉 Normalization: It scales each feature separately to a fixed range. Usually, the range [0,1] is used. To scale the features to this range, the minimum and maximum of each feature in the dataset must be calculated. It is also known as min-max normalization.
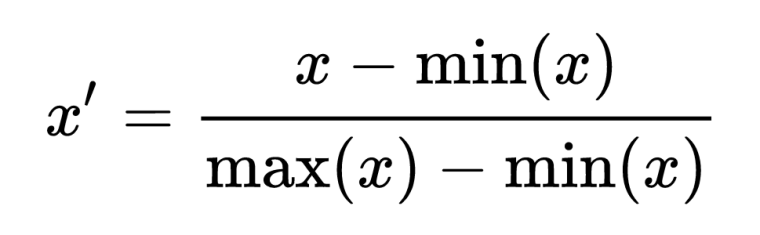
Image Source: Link
Interviewer: Why is ReLU the most commonly used activation function?
Candidate:
👉 No vanishing gradient: The derivative of the RELU activation function is either 0 or 1, so, it could be not in the range of [0,1]. As a result, the product of several derivatives would also be either 0 or 1, because of this property, the vanishing gradient problem doesn’t occur during backpropagation.
👉 Faster training: Networks with RELU tend to show better convergence performance. Therefore, we have a much lower run time.
👉 Sparsity: For all negative inputs, a RELU generates an output of 0. This means that fewer neurons of the network are firing. So we have sparse and efficient activations in the neural network.
Interviewer: Is Multicollinearity good or bad for our regression model and how do you check if there is Multicollinearity present in our dataset or not?
Candidate:
👉 Multicollinearity is not good for our regression models.
👉 Variance Inflation Factor(VIF) is the measure of the volume of multicollinearity in a collection of many regression variables.
👉 VIF = Variance of the model / Variance of the model with a single predictor
👉 We have to calculate this ratio for every independent variable(predictor). If we got the value of VIF as high, then it clearly shows the high collinearity of the independent variables.
For further reference, refer to the link
Interviewer: What is the difference between Forwarding propagation and Backward propagation in neural networks?
Candidate:
👉 Forward propagation: The input is fed into the network. In each layer, there is a specific activation function and between layers, there are weights that represent the connection strength of the neurons. The input runs through the individual layers of the network, which ultimately generates an output.
👉 Backward propagation: an error function measures how accurate the output of the network is. To improve the output, the weights have to be optimized. The backpropagation algorithm is used to determine how the individual weights have to be adjusted. The weights are adjusted during the gradient descent method.
Interviewer: Have you heard of Hamming Distance? Explain with the help of an example.
Candidate:
We use hamming distance if we need to tackle categorical variables. Hamming distance measures whether the two variables are different or not. When they are equal, the distance value is 0, otherwise, it is 1.
For Example,
Let’s consider two one-hot encoded vectors of 2 strings.
Euclidean- [1, 0, 0, 0, 0]
Manhattan- [0, 0, 1, 0, 0]
The distance between two vectors could be calculated as the sum of the average number of bit differences between the two strings.
So, here the distance is 1.
Disadvantages:
👉 It will not work when the two vectors are of different lengths.
👉 It does not take the actual value into account as soon as they are different or equal.
When to use it?
It is mostly used to measure the distance between categorical variables.
Interviewer: Overfitting is one of the most common problems every machine learning practitioner faces. Can you tell me some methods to avoid overfitting in neural networks?
Candidate:
👉 Dropout: It is a regularization technique that prevents the neural network from overfitting. It randomly drops neurons from the neural network during training which is equivalent to training different neural networks. The different networks will overfit differently, so the net effect of the dropout regularization technique will be to reduce overfitting so that our model will be good for predictive analysis.

Image Source: Link
👉 Early stopping: This regularization technique updates the model to make it better fit the training data with each iteration. After a certain number of iterations, new iterations improve the model. After that point, however, the model begins to overfit the training data. Early stopping refers to stopping the training process before that point.

Image Source: Link
Interviewer: Let’s have a class of students and we want to analyze some of the statistics related to the whole class where we required the average height of the students in the class. Can you tell me how you formulate this problem? Tell me the approach only.
Candidate:
👉 Firstly, we will define the confidence level (the most common is 95%).
👉 Then, take a sample of students from the class (to get better results the number of students > 30, so that we can use the Central Limit Theorem of Statistics).
👉 Now, we will try to calculate the mean and standard deviation of the heights for the sample students.
👉 Calculate t-statistics
👉 Get the confidence interval in which the average height of all the students should be.
That solves our problem.
Interviewer: Tell me some loss functions which are used for Classification and Regression Techniques.
Candidate:
For Regression:
- Mean squared logarithmic error(MSLE)
For Binary Classification:
For Multiclass Classification:
- Kullback- Leibler Divergence
Interviewer: Ensemble Learning is based on the idea that “Unity is Strength”. Can you explain some of these techniques which are used in Machine Learning?
Candidate:
Ensemble learning Technique in Machine Learning combines the predictions from multiple models to improve the overall performance. The most common ensemble techniques are:
👉 Bagging: For Bagging, we usually create several subsets of data from the training sample. Each collection of subset data is used to train their model in a parallel way. Average of all the predictions from different models are used which is more robust than a single model.
👉 Boosting: Unlike Bagging that had each model trained independently, the idea of boosting is to train weak learners sequentially, each trying to correct its predecessor. Adaboost, Gradient Boost, and XGBoost are the most common boosting techniques.

Image Source: Link
Interviewer: Have you heard about Multi-Task Learning. Explain.
Candidate:
Multi-Task learning is a sub-field of machine learning that tries to solve multiple different tasks at the same time, by taking advantage of the similarities between different tasks, using a shared representation.
For Example, Multi-task learning can be used to build an object classification system for a self-driving car.
👉 Hard Parameter Sharing: A common hidden layer is used for all tasks while task-specific layers are kept separated towards the end of the model. This method is very useful since it learns a representation for various tasks by a common hidden layer.
👉 Soft Parameter Sharing: Each model has separate sets of weights and biases and the similarity between these parameters in different models is regularized so that the parameters become similar and can represent all the tasks.
P.S: The solutions to the questions are provided below them for a quick reference.
I hope after going through this article you will gain an insight into which types of questions are asked in the Interview.
For further queries, you can ping me in the comments sections. I will be happy to reply to your queries asap. 😀
Other Blog Posts by Me
You can also check my previous blog posts.
Previous Data Science Blog posts.
Here is my Linkedin profile in case you want to connect with me. I’ll be happy to be connected with you.
For any queries, you can mail me on Gmail.
Endnotes
Thanks for reading!
I hope that you have enjoyed the article. If you like it, share it with your friends also. Something not mentioned or want to share your thoughts? Feel free to comment below And I’ll get back to you. 😉
- CHIRAG GOYAL
- Mar, 06 2022