Tableau vs Power BI - Features Comparison
Power BI Vs Tableau
Power BI and Tableau are two important Business Intelligence (BI) technologies for the collection, integration, analysis, and presentation of business information. They help you perform data analysis, data manipulation, and data visualization to make sense of business data and draw insights. Often learners, practitioners, and researchers come into a dilemma to decide which one of the tools they should learn or use in their work. Let's jump on to the significant differences between Power and Tableau and help you overcome some of the challenges.
Power BI is a business analytics service provided by Microsoft that can analyze and visualize data, extract insights, and share it across various departments within your organization. While Tableau is a powerful Business Intelligence tool that manages the data flow and turns data into actionable information. It can create a wide range of different visualization to present the data and showcase insights interactively.
History of Power BI and Tableau
 |  |
| Power BI has an easy drag and drops functionality, with features that allow you to copy all formatting across similar visualizations. | Tableau has the feature of drag-n-drop, which allows its users to create interactive visuals quickly. It can also build interactive dashboards with just a few clicks. |
| Ron George originally designed power BI in the summer of 2010, and the initial release was available for public download on 11 July 2011. | Tableau Software was founded in 2003 in Mountain View, California, and Tableau Desktop 1.0 was released in 2004. On 1 August 2019, Salesforce acquired Tableau. |
| The critical components of Power BI are Power BI Desktop, Power Bi Service, Power BI Mobile Apps, Power BI Gateway, and Power BI Report Server. | Tableau products include Tableau Desktop, Tableau Server, Tableau Online, Tableau Vizable, Tableau Public, and Tableau Reader. |
Cost of Power BI and Tableau
Power BI
| Tableau
|
| Power BI is cheaper than Tableau software. Power BI professional version costs less than $10 per month per user. The yearly subscription comes around $100. Power BI Premium is licensed by dedicated cloud compute and storage resources and is priced at $4,995/month. | Tableau is more expensive, where the pro version of Tableau comes at more than $35 per month per user. The yearly subscription costs around $1000. Tableau Creator costs around $70/ month, while Tableau Viewer is priced at $12/month. If you are a startup or a small business, you can opt for Power BI and then upgrade to Tableau if the need arises. |


Performance of Power BI and Tableau
Power BI
| Tableau
|
| Power BI is easy to use. It is faster and performs better when the volume of data is limited. Power BI tends to drag slowly while handling bulk data. | Tableau can handle large volumes of data quickly. It is faster and provides extensive features for visualizing the data. Tableau doesn't limit the number of data points in visualization or enforce row or size limitations, giving you a 360-degree view of your data. |


User Interface of Power BI and Tableau
Power BI
| Tableau
|
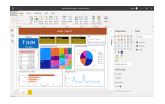
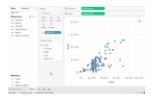
| The user interface of Power BI is intuitive, and it can easily be integrated with other Microsoft products. Power BI interface is easy to learn and understand. It is user friendly and allows you to operate better. Power BI Desktop provides three views that you can select on the left side of the canvas - the report view, the data view, and the model view. | Tableau has an intelligent interface that enables you to create and customize the dashboards according to your requirements. It has an inviting workspace area that encourages you to experiment with data and get smart results. The workspace area has different cards and shelves, toolbar, sidebar, data source page, status bar, and sheet tabs. |

Data Sources in Power BI and Tableau
Power BI
| Tableau
|
| Power BI is that it supports various data sources but has limited access to other databases and servers compared to Tableau. Some of the examples are Microsoft Excel, Text/CSV, Folders, MS SQL Server, Access DB, Oracle Database, IBM DB2, MySQL database, PostgreSQL database, etc. | Tableau Software has access to numerous data sources and servers such as Excel, Text File, PDF, JSON, statistical file, Amazon Redshift, Cloudera Hadoop, Google Analytics, dropbox, google sheets, google drive and others. |


Ease of Using Power BI and Tableau
Power BI
| Tableau
|
| Power BI has an edge because of its ease of use since it is based on a user interface that has its roots in Microsoft Office 365, which most end-users are already familiar with. | Tableau provides some essential advantages for exploring and visualizing data in detail. Tableau is also incorporating natural language capabilities into its software. This helps in finding solutions to complex problems by understanding the data better. |


Programming Support for Power BI and Tableau
Power BI
| Tableau
|
| Power BI supports Data Analysis Expression and M language for data manipulation and data modeling. It can also connect to the R programming language using Microsoft revolution analytics, but it is available only for enterprise-level users. | Compared to Power BI, Tableau integrates much better with the R language. Tableau Software Development Kit can be implemented using any of the four programming languages - C, C++, Java, and Python. By connecting to these programming languages, you can build even more powerful visualizations. |


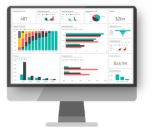
Data Visualization in Power BI and Tableau
Power BI
| Tableau
|
| Power BI provides an easy to use drag and drop functionality. It provides features that make data visually appealing. Power BI offers a wide range of detailed and attractive visualizations to create reports and dashboards. Using Power BI service, you can ask questions about your data, and it will give you meaningful insights. | Tableau also allows its users to customize dashboards specifically for a device. It delivers interactive visuals that support insights on the fly. It can translate queries to visualizations and makes you ask questions, spot trends, and identify opportunities. You don't require any prior knowledge to work on Tableau since it provides in-built table calculations to build reports and dashboards. |
Machine Learning in Power BI and Tableau
Power BI
| Tableau
|
| Power BI enjoys the advantages of Microsoft business analytics that includes platforms such as Azure Machine learning, SQL Server based Analysis Services, data streaming in real-time, and many Azure databases offers. It helps to understand the data and analyze the trends and patterns in the data. | Tableau supports the features of Python machine learning. This allows us to perform machine learning operations over the datasets and forecast data. |


Customer Support in Power BI and Tableau
Power BI
| Tableau
|
| Microsoft Power BI is relatively younger in the market than Tableau and hence has a smaller community. | While Tableau has over 160,000 active users participating in over 500 global user groups and over 150,000 active customers participating in the Tableau online community. |


The table below compares the data source integration capability of the two platforms for some major data sources:
| Data Source | Power BI | Tableau |
| Adobe Analytics | Yes | No |
| Amazon Redshift | Yes | Yes |
| Alibaba Data Lake and Analytics | No | Yes |
| Excel | Yes | Yes |
| Yes | No | |
| Google Analytics | Yes | Yes |
| Google Ads | No | Yes |
| BigQuery | Yes | Yes |
| Hadoop | Yes | Yes |
| IBM DB2 | Yes | Yes |
| MySQL | Yes | Yes |
| Oracle | Yes | Yes |
| PostgreSQL | Yes | Yes |
| R Script | Yes | Yes |
| Python Script | Yes | Yes |
| SalesForce Report | Yes | Yes |
| Spark | Yes | Yes |
| SQL Server | Yes | Yes |
| Json | Yes | Yes |
| Azure SQL | Yes | Yes |
| Text File | Yes | Yes |
Advantages of Power BI and Tableau
Power BI Advantages
- Price: Power BI provides all the features and services at US$10 per user per month. With Power BI Pro, the user can access the whole range of Power BI components, along with Microsoft Services such as Cortana for running voice-based queries.
- MSFT integration: Power BI can easily integrate with Azure/O365 and anything else that Microsoft has created, which proves to be a huge advantage for the user by smoothly running all operations on Microsoft.
- Ease of use: For a newbie, Power BI provides an intuitive learning curve, and the interface resembles that of MS Excel, which makes it easier to navigate. In Power BI, we can take the advantage of DAX query language and execute the queries on datasets in natural language.
- ETL/Discovery suite: When compared to Tableau, Power BI has a robust set of tools for implementing ETL capabilities. Data preparation is more than 90% of any reporting requirement, and Power BI can directly build these reporting data marts without involving third-party software.
Tableau Advantages
- High performance: Tableau provides high visualization and data transformation capabilities to the user. Also, it operates faster on big datasets with better efficiency. This high-performance feature gives Tableau an edge over other Data Analytics toolkits.
- Multiple data source connections: Tableau can establish connections with more data sources such as Hadoop, DB technologies, SAP, and Google BigQuery. This improves the quality of data analysis and enables the user to create informative reports. Reports with such connections deliver accurate information about the situation and help the user make better decisions. Tableau uses languages such as Python and R for complex table calculations and avoids any performance drop.
- Thriving community and forum: Through collaboration and sharing, Tableau fans provide useful insights and resources in the community that helps newbies increase their knowledge on data parsing and reporting. By sharing the experience with the software, the forum visitors help any user settle their issues.
- Mobile-friendliness: With mobile apps, Tableau enables users to keep all the statistics at their fingertips. Tableau apps are available for both Android and iOS devices and support all the functions that Tableau Desktop has.
Disadvantages of Power BI and Tableau
Power BI Disadvantages
- Table relationships: Power BI is prone to running into difficulties while handling data that has complex relationships with tables. In many cases, data models need to be carefully created with unique fields for the sole purpose of joining tables together.
- User interface: Power BI has a cluttered interface with many icon options obstructing the view of reports and dashboards. Additionally, Tooltip in Power BI also has limited functionality.
- Compatibility with iOS: Power BI does not have a compatible option for desktop Mac users. Power BI cannot be directly installed in iOS; a virtual machine needs to be installed to run Power BI Desktop.
- Limited Excel integration: Excel integration is a major advantage of Power BI, but only data of up to 150,000 rows can be downloaded, which can be very limiting at times.
Tableau Disadvantages
- High cost: Tableau is not much expensive if we compare it with BI giants such as IBM and Oracle. However, the license is more expensive when put in the same bucket with other competitors like Power BI. It will not be an issue for big organizations but will be a considerable disadvantage for small or medium companies where money is the central focus for all decisions made.
Besides, Tableau requires proper implementation, maintenance, and staff training for effective analysis. Therefore, it is best for the organizations that can pay for the licensing cost.
- Steep learning curve: In light of the learning curve, Tableau is quite steep as the user has to get proper training in data analysis and acquire decent skills in R and Python programming. Also, the process of data extraction, transformation, data modeling, and visualization is pretty manual, which means that we might face data incompetency while connecting our data sources with Tableau.
- Hima Patel
- Jun, 21 2022