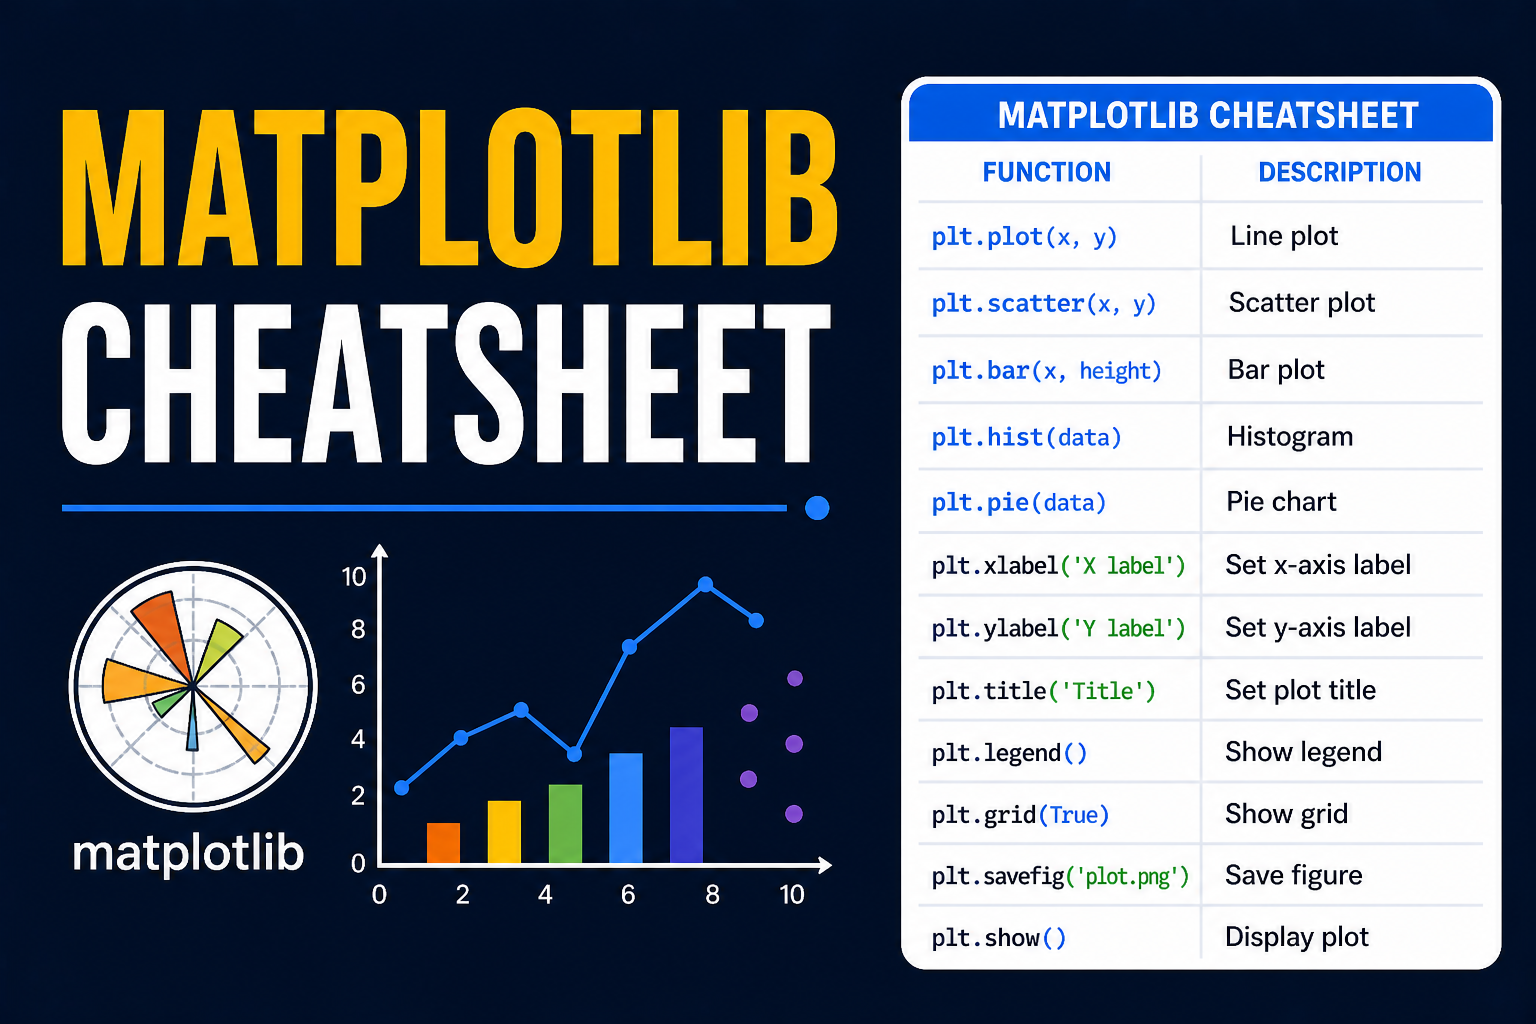
The Matplotlib cheat sheet is a quick reference guide that covers the essential functions and syntax used for data visualization in Python. It typically includes creating basic plots such as line charts, bar graphs, histograms, and scatter plots. It also highlights key concepts like customizing plots (titles, labels, and legends); styling; subplots; and working with figures and axes, helping users create clear and effective visualizations. Suitable for beginners and experienced users, it enables quick recall of commonly used commands and simplifies the process of building and customizing charts for data analysis.
