Complete Guide to Power BI by Zep Analytics
As a Data Analyst the most important skill is Data Visualization. Data Visualization is basically an art which is performed by Data Analyst.
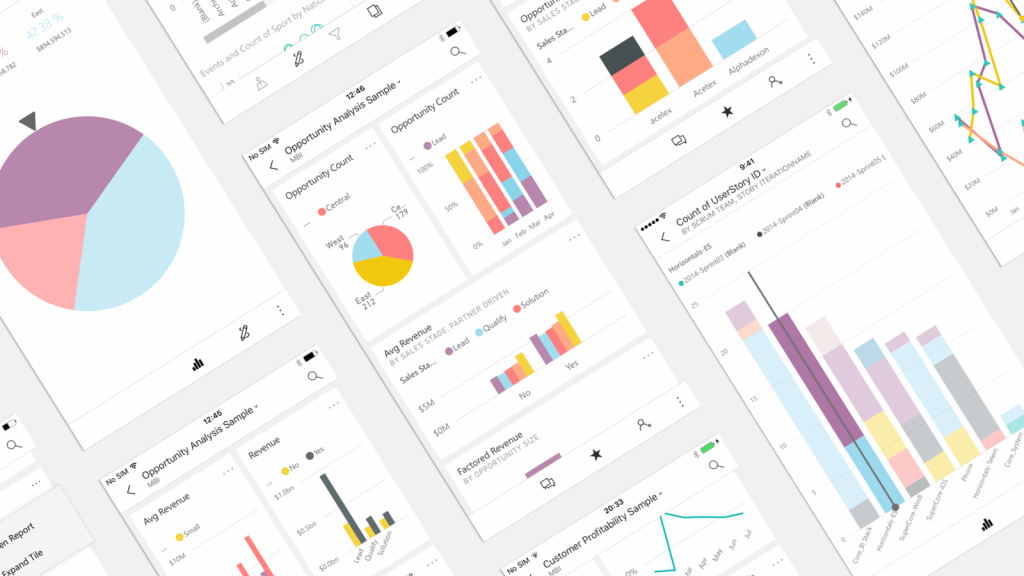
There are many various Data Visualization tools such as Power BI, Tableau, DOMO BI, Excel, Data Studio, etc. But among all this tools, the most famous tool is Power BI.
Power BI is a tool owned and developed by Microsoft. It is used for Reporting and Dashboard making. With intense features of Power BI and rich visualizations, it is one of the most used Business Intelligence tool in the market.
You can make Dashboards for various domains in Power BI. Some of the examples are,

The above dashboard is a customer analysis dashboard developed in Power BI.
Isn’t it beautiful?? Want to see one more like this…

This is an HR dashboard which is developed in Power BI. Isn’t it interesting???
So, do you want to make such dashboards? For making such awesome dashboards first you need to learn Power BI.
So here at Zep Analytics we have created a series of Power BI blogs which will go through the journey of learning Power BI through few blogs.
So here is the list of the blogs
Introduction to Power BI - This is a introductory blog where you will get to know more about Power BI and its components in a beautiful manner.
Power BI Architecture - Before going in deepness of learning something new it is important to know how it functions and it is made. In this article you will study about Power BI Architecture.
7 Pillars of Power BI - This pillars are the rules and features that Power BI is based on and using this you can kickstart you Power BI journey.
Power BI Interface and Workflow - Getting familiar with Interfaces and Workflow is important so that you can start learning practically. So in this article you are going to learn about the same.
Visualizations in Power BI - As I mentioned Power BI is rich in visualizations and there are even many third party visualizations used. Here we will study the inbuilt visualizations available in Power BI.
Power Query Editor - In this article we are going to study about Power Query Editor. It is also known as Heart Of Power BI. All the pre-processing and Data cleaning part is covered in this Power Query Editor.
Data Modeling in Power BI - Data modelling is one of the most important aspects of data analysis, regardless of the tools we use, and Power BI is not an exception. After we import data into the data model, we need to create and manage relationships, create analytical calculations and implement the business logic available for data visualization.
DAX in Power BI - Data Analysis Expressions, commonly known as DAX, is the formula language that drives Power BI. So its a complete guide for beginners through which you can study DAX effectively.
KPI’s in Power BI - KPIs are used to determine a company's strategic, financial, and operational accomplishments, especially when compared to those of other companies in the same industry. In Power BI you can effectively work with KPI’s.
Roles in Power BI - Workspaces are places to collaborate with colleagues and create collections of dashboards, reports, datasets, and paginated reports. This article describes the different roles in the new workspaces, and what people in each role can do.
How to make dashboard more attractive - The last blog is about interactive dashboards. Here you will get all the tips required to make beautiful dashboards.
I hope you liked this series. Let us know in the comment section.
Thank you,
Happy Learning!!
- ZA Admin
- Jun, 15 2022
Malleswari Dirisala
more useful.thank you for your efforts.i am going to start today power bi with your blogs